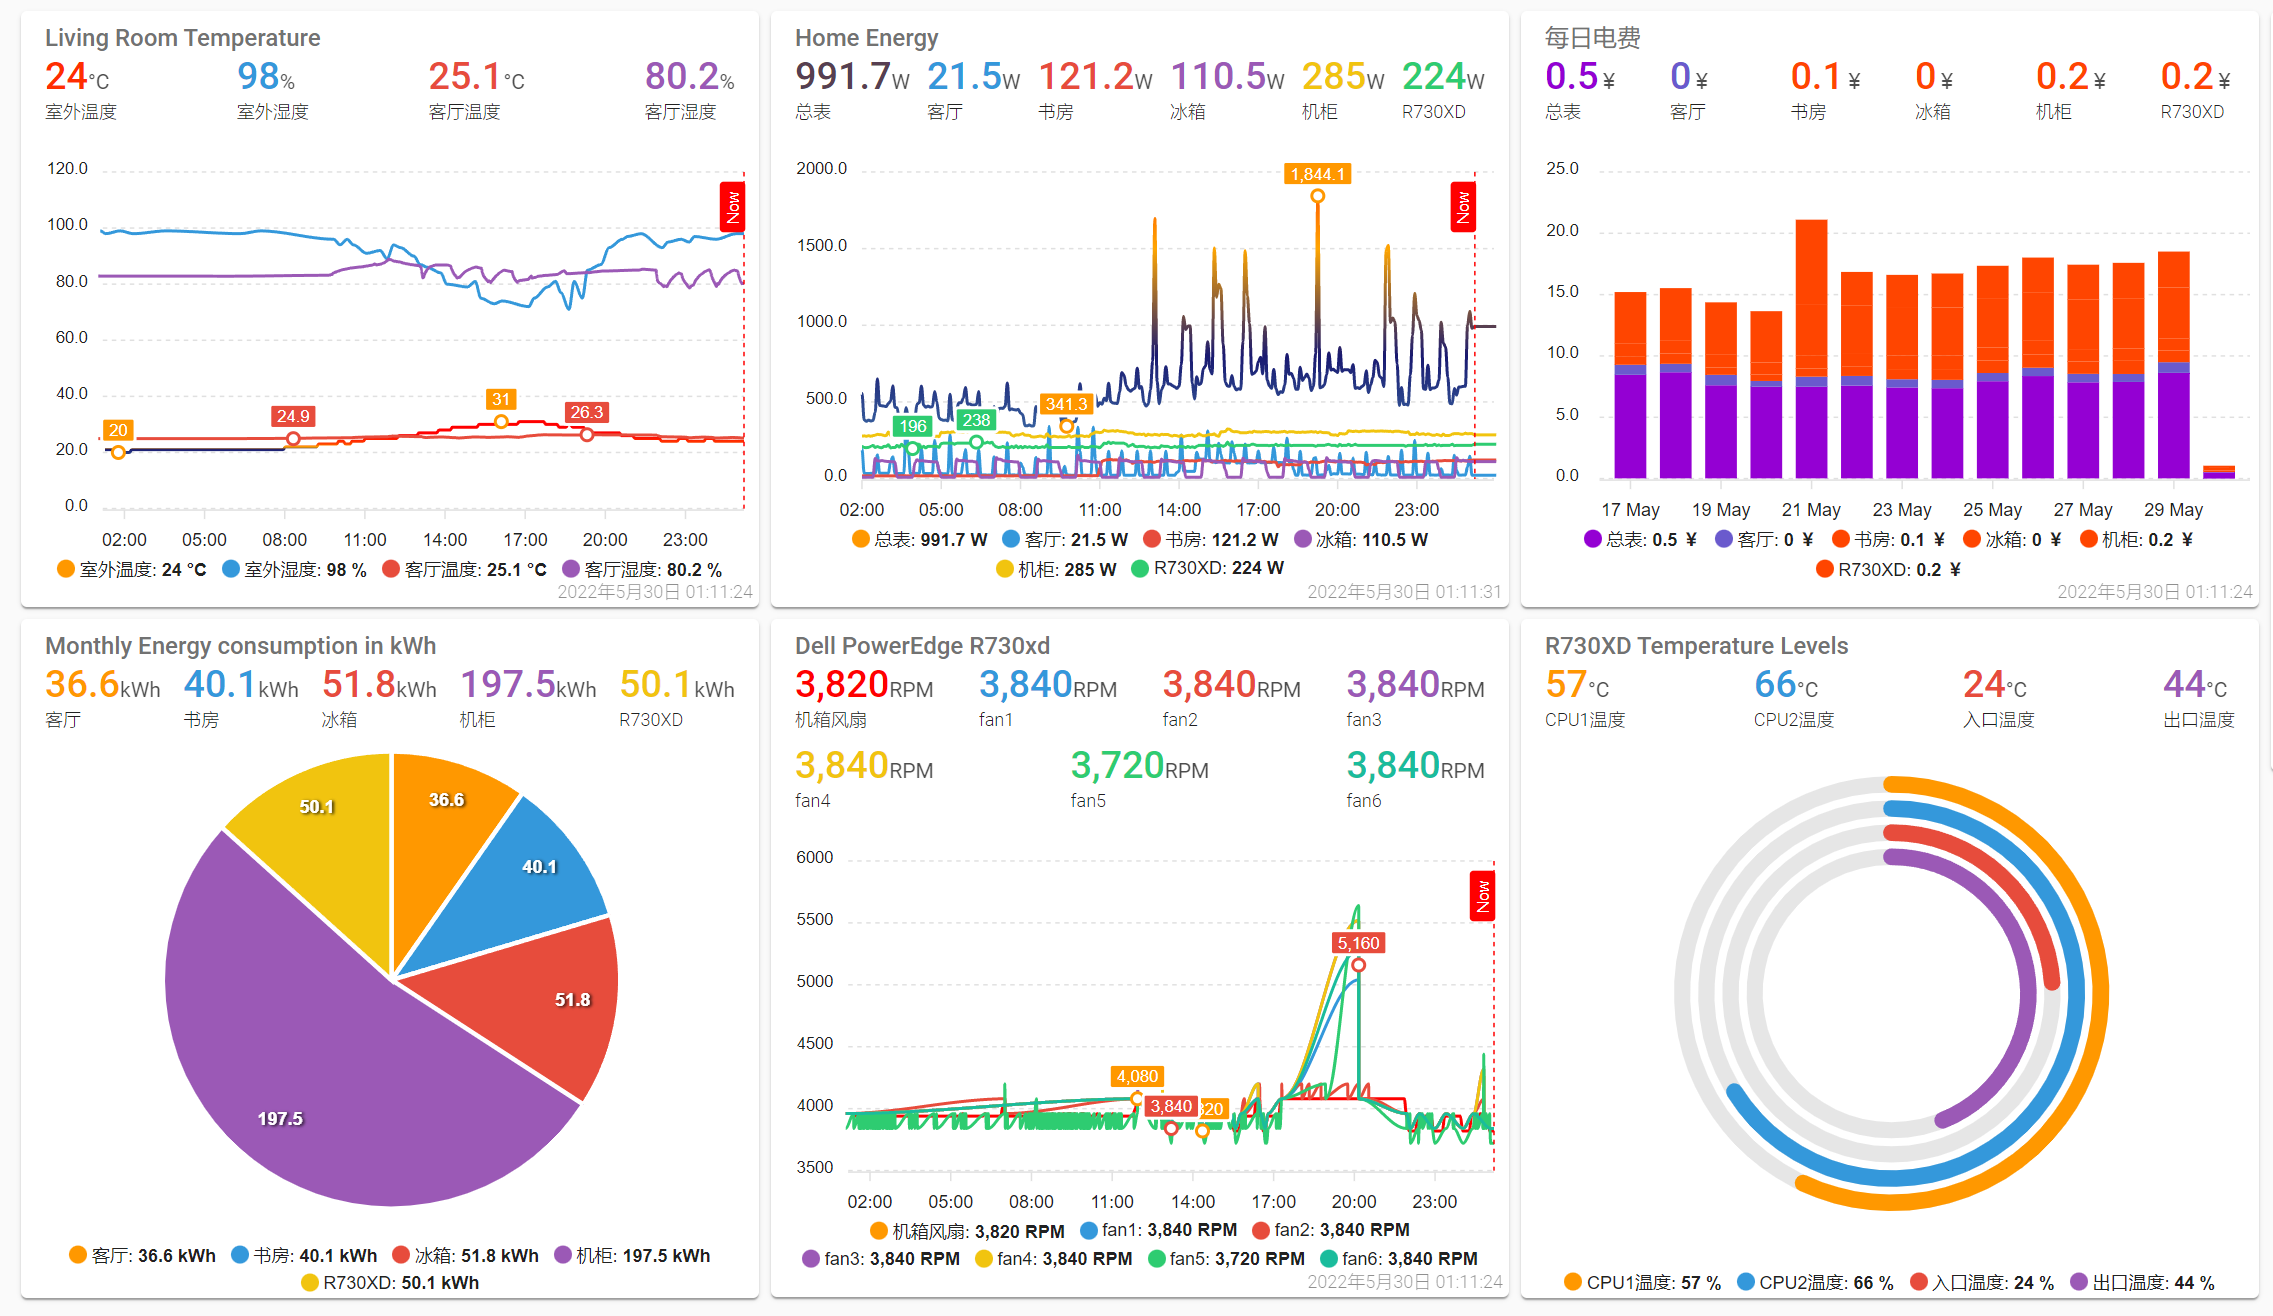
HomeAssistant超级漂亮的界面
接入Home Assistant效果:
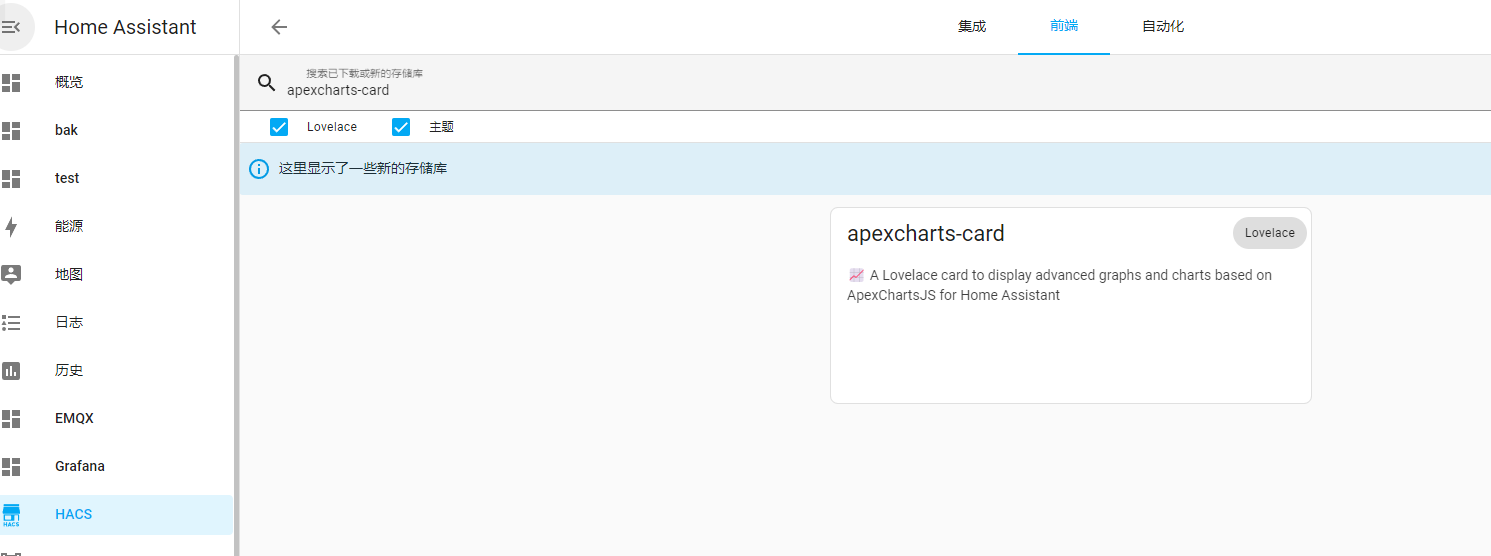
安装插件:
插件项目地址:RomRider/apexcharts-card: 📈 A Lovelace card to display advanced graphs and charts based on ApexChartsJS for Home Assistant (github.com)
首先安装apexcharts-card插件,你可以直接安装也可以通过hacs
界面UI:
卡片的配置:
1-1
1
2
3
4
5
6
7
8
9
10
11
12
13
14
15
16
17
18
19
20
21
22
23
24
25
26
27
28
29
30
31
32
33
34
35
36
37
38
39
40
41
42
43
44
45
46
47
48
49
50
51
52
53
54
| type: custom:apexcharts-card
experimental:
color_threshold: true
graph_span: 24h
show:
last_updated: true
header:
standard_format: false
show: true
show_states: true
colorize_states: true
title: Living Room Temperature
now:
show: true
color: red
label: Now
series:
- entity: sensor.weather_temperature
name: 室外温度
type: line
group_by:
func: last
duration: 5m
stroke_width: 2
show:
extremas: true
header_color_threshold: true
color_threshold:
- value: 18
color: steelblue
- value: 21
color: midnightblue
- value: 22
color: orange
- value: 23
color: orangered
- value: 26
color: red
- entity: sensor.weather_humidity
name: 室外湿度
stroke_width: 2
show:
in_chart: true
- entity: sensor.0xa4c1380a60008845_temperature
name: 客厅温度
stroke_width: 2
show:
extremas: true
header_color_threshold: true
- entity: sensor.0xa4c1380a60008845_humidity
name: 客厅湿度
stroke_width: 2
show:
in_chart: true
|
1-2
1
2
3
4
5
6
7
8
9
10
11
12
13
14
15
16
17
18
19
20
21
22
23
24
25
26
27
28
29
30
31
32
33
34
35
36
37
38
39
40
41
42
43
44
45
46
47
48
49
50
51
52
53
54
55
56
57
58
59
60
61
62
63
64
65
66
67
68
69
70
71
72
73
74
75
76
77
78
79
80
| type: custom:apexcharts-card
experimental:
color_threshold: true
graph_span: 24h
show:
last_updated: true
header:
standard_format: false
show: true
show_states: true
colorize_states: true
title: Home Energy
now:
show: true
color: red
label: Now
span:
end: hour
series:
- entity: sensor.meter_power
name: 总表
type: line
group_by:
func: avg
duration: 5m
stroke_width: 2
show:
extremas: true
header_color_threshold: true
color_threshold:
- value: 100
color: steelblue
- value: 800
color: midnightblue
- value: 1500
color: orange
- value: 2000
color: orangered
- value: 3000
color: red
- entity: sensor.relay_2053cd_power
name: 客厅
stroke_width: 2
group_by:
func: avg
duration: 5min
- entity: sensor.relay_ecf998_power
name: 书房
stroke_width: 2
show:
in_chart: true
group_by:
func: avg
duration: 5min
- entity: sensor.plug_158d0001b19931_power
name: 冰箱
stroke_width: 2
show:
in_chart: true
group_by:
func: avg
duration: 5min
- entity: sensor.cabinet_meter_power
name: 机柜
stroke_width: 2
show:
in_chart: true
group_by:
func: avg
duration: 5min
- entity: sensor.server_power
name: R730XD
stroke_width: 2
show:
in_chart: true
extremas: true
header_color_threshold: true
group_by:
func: avg
duration: 5min
|
1-3
1
2
3
4
5
6
7
8
9
10
11
12
13
14
15
16
17
18
19
20
21
22
23
24
25
26
27
28
29
30
31
32
33
34
35
36
37
38
39
40
41
42
43
44
45
46
47
48
49
50
51
52
53
54
55
56
57
| type: custom:apexcharts-card
apex_config:
chart:
stacked: true
graph_span: 14d
span:
end: day
show:
last_updated: true
header:
show: true
show_states: true
colorize_states: true
title: 每日电费
series:
- entity: sensor.meter_energy_daily_money
name: 总表
type: column
color: darkviolet
group_by:
func: max
duration: 1d
- entity: sensor.relay_2053cd_daily_money
name: 客厅
type: column
color: slateblue
group_by:
func: max
duration: 1d
- entity: sensor.relay_ecf998_daily_money
name: 书房
type: column
color: orangered
group_by:
func: max
duration: 1d
- entity: sensor.plug_158d0001b19931_energy_daily_money
name: 冰箱
type: column
color: orangered
group_by:
func: max
duration: 1d
- entity: sensor.cabinet_meter_energy_daily_money
name: 机柜
type: column
color: orangered
group_by:
func: max
duration: 1d
- entity: sensor.server_powerusage_daily_money
name: R730XD
type: column
color: orangered
group_by:
func: max
duration: 1d
|
2-1
1
2
3
4
5
6
7
8
9
10
11
12
13
14
15
16
17
18
| type: custom:apexcharts-card
chart_type: pie
header:
show: true
show_states: true
colorize_states: true
title: Monthly Energy consumption in kWh
series:
- entity: sensor.relay_2053cd_monthly
name: 客厅
- entity: sensor.relay_ecf998_monthly
name: 书房
- entity: sensor.plug_158d0001b19931_energy_monthly
name: 冰箱
- entity: sensor.cabinet_meter_energy_monthly
name: 机柜
- entity: sensor.server_powerusage_monthly
name: R730XD
|
2-2
1
2
3
4
5
6
7
8
9
10
11
12
13
14
15
16
17
18
19
20
21
22
23
24
25
26
27
28
29
30
31
32
33
34
35
36
37
38
39
40
41
42
43
44
45
46
47
48
49
50
51
52
53
54
55
56
57
58
59
60
61
62
63
64
65
66
67
68
69
| type: custom:apexcharts-card
experimental:
color_threshold: true
graph_span: 24h
show:
last_updated: true
header:
standard_format: false
show: true
show_states: true
colorize_states: true
title: Dell PowerEdge R730xd
now:
show: true
color: red
label: Now
series:
- entity: sensor.server_fans_speed_avg
name: 机箱风扇
type: line
group_by:
func: last
duration: 5m
stroke_width: 2
show:
extremas: true
header_color_threshold: true
color_threshold:
- value: 18
color: steelblue
- value: 21
color: midnightblue
- value: 22
color: orange
- value: 23
color: orangered
- value: 26
color: red
- entity: sensor.rawdellserverfan1
name: fan1
stroke_width: 2
show:
in_chart: true
- entity: sensor.rawdellserverfan2
name: fan2
stroke_width: 2
show:
extremas: true
header_color_threshold: true
- entity: sensor.rawdellserverfan3
name: fan3
stroke_width: 2
show:
in_chart: true
- entity: sensor.rawdellserverfan4
name: fan4
stroke_width: 2
show:
in_chart: true
- entity: sensor.rawdellserverfan5
name: fan5
stroke_width: 2
show:
in_chart: true
- entity: sensor.rawdellserverfan6
name: fan6
stroke_width: 2
show:
in_chart: true
|
2-3
1
2
3
4
5
6
7
8
9
10
11
12
13
14
15
16
| type: custom:apexcharts-card
header:
show: true
title: R730XD Temperature Levels
show_states: true
colorize_states: true
chart_type: radialBar
series:
- entity: sensor.server_cpu1_temperature
name: CPU1温度
- entity: sensor.server_cpu2_temperature
name: CPU2温度
- entity: sensor.server_inlet_temperature
name: 入口温度
- entity: sensor.server_exhaust_temperature
name: 出口温度
|
资源:
1.HACS:HACS (github.com)
2.apexcharts-card: RomRider/apexcharts-card: 📈 A Lovelace card to display advanced graphs and charts based on ApexChartsJS for Home Assistant (github.com)
开源协议: 请遵循原作者的开源协议